
AI Needs Power—The Grid Can't Keep Up
The AI boom has a constraint most of the market isn’t pricing. It’s not chips. It’s not capital. It’s permission to connect to the grid.

Two Out of Three Power Projects in America’s Largest Grid Never Get Built
Two out of three power projects never get built.
Not because they fail. Because the system rejects them.
The AI boom has a constraint most of the market isn’t pricing.
It’s not chips.
It’s not capital.
It’s permission to connect to the grid.
In the largest U.S. power market, two out of every three projects that apply to connect eventually withdraw.
Not because the economics failed.
Not because financing fell through.
Because the process itself broke them.
That is the grid your AI infrastructure depends on. And that failure rate is not an anomaly. It’s the system working exactly as designed.
There are currently:
– ~2.3 terawatts of capacity waiting in interconnection queues
– ~1.2 terawatts installed across the U.S. grid
– More than 25,000 active projects
– A median wait time of 3–7 years
– Withdrawal rates exceeding 60% in some regions

The market is PJM Interconnection.
Thirteen states from New Jersey to Illinois.
65 million people.
The grid that powers the mid-Atlantic, the industrial Midwest, and the nation’s capital.
Its interconnection queue has a 67.4% withdrawal rate.
In California’s CAISO, the number is 75.6%.
Three-quarters of projects in the most aggressive clean energy market in the country never make it through.
The queue is nearly twice the grid.
2,300 gigawatts of generating capacity is waiting for permission to connect.
1,200 gigawatts is installed today—nationwide.
There are 9,251 projects in PJM alone (active + withdrawn + operational).
67.4% (of all projects that have entered historically) will withdraw.
CAISO: 75.6%.
ERCOT: 0.0%.
We’ll come back to ERCOT (below the paywall).
A single AI training campus requires 500 MW to 1 GW of continuous power.
That is a mid-sized city.
Microsoft, Alphabet, Amazon, and Meta are deploying roughly $650 billion annually into infrastructure.
Almost all of it is pointed at data centers.
A transmission line takes 7 to 12 years to complete.
A data center takes two to three.
Why The Queue Exists — and Why It’s Breaking
You can’t plug a 500-megawatt power plant into a transmission network the way you plug a laptop into a wall socket.
Before generation can deliver power, it must pass through a formal interconnection process — engineering studies that determine whether the grid can absorb the new capacity without browning out your Netflix stream.
Power flows are governed by physics. If you connect a new plant that destabilizes voltage or frequency, it can bring down an entire region.
The studies exist for a reason.
But the process was designed for a world where a handful of new plants connected each year. It was not designed to handle the current volume hitting the system.
The result is not a backlog. It is a structural filter — one that selects not for the best projects, but for the deepest pockets and the most patience.
The Scale of What’s Stuck
There are currently 25,018 projects in active interconnection queues across U.S. ISOs and non-ISO regions. Together, they represent 2,300 gigawatts of generating capacity — nearly double the entire installed capacity of the United States.
Not all these projects will be built. Many are speculative. Some are duplicative filings by the same developer hedging across grid regions. But the withdrawal rates tell you something the raw numbers don’t.
Developers enter, pay study fees, wait through multiple study cycles, and leave. In some regions, the majority never connect. The median project has been waiting years. Most will never reach commercial operation.
A hyperscale data center does not need 5 megawatts in a convenient location. It needs 100 to 500 megawatts of continuous, uninterruptible power in a specific place, on a specific timeline, with contractual penalties if the lights do not turn on when the lease begins.
That kind of demand is concentrated, inflexible, and time-sensitive. When it collides with a queue system designed for distributed, flexible, patient demand, the result is not a queue.
It’s a wall.

The Constraint Isn’t Evenly Distributed
What matters isn’t just that the grid is constrained.
It’s where.
Some regions are processing capacity.
Others are absorbing demand they can’t convert into power.
That difference determines where infrastructure actually gets built.
This is what we’re building:
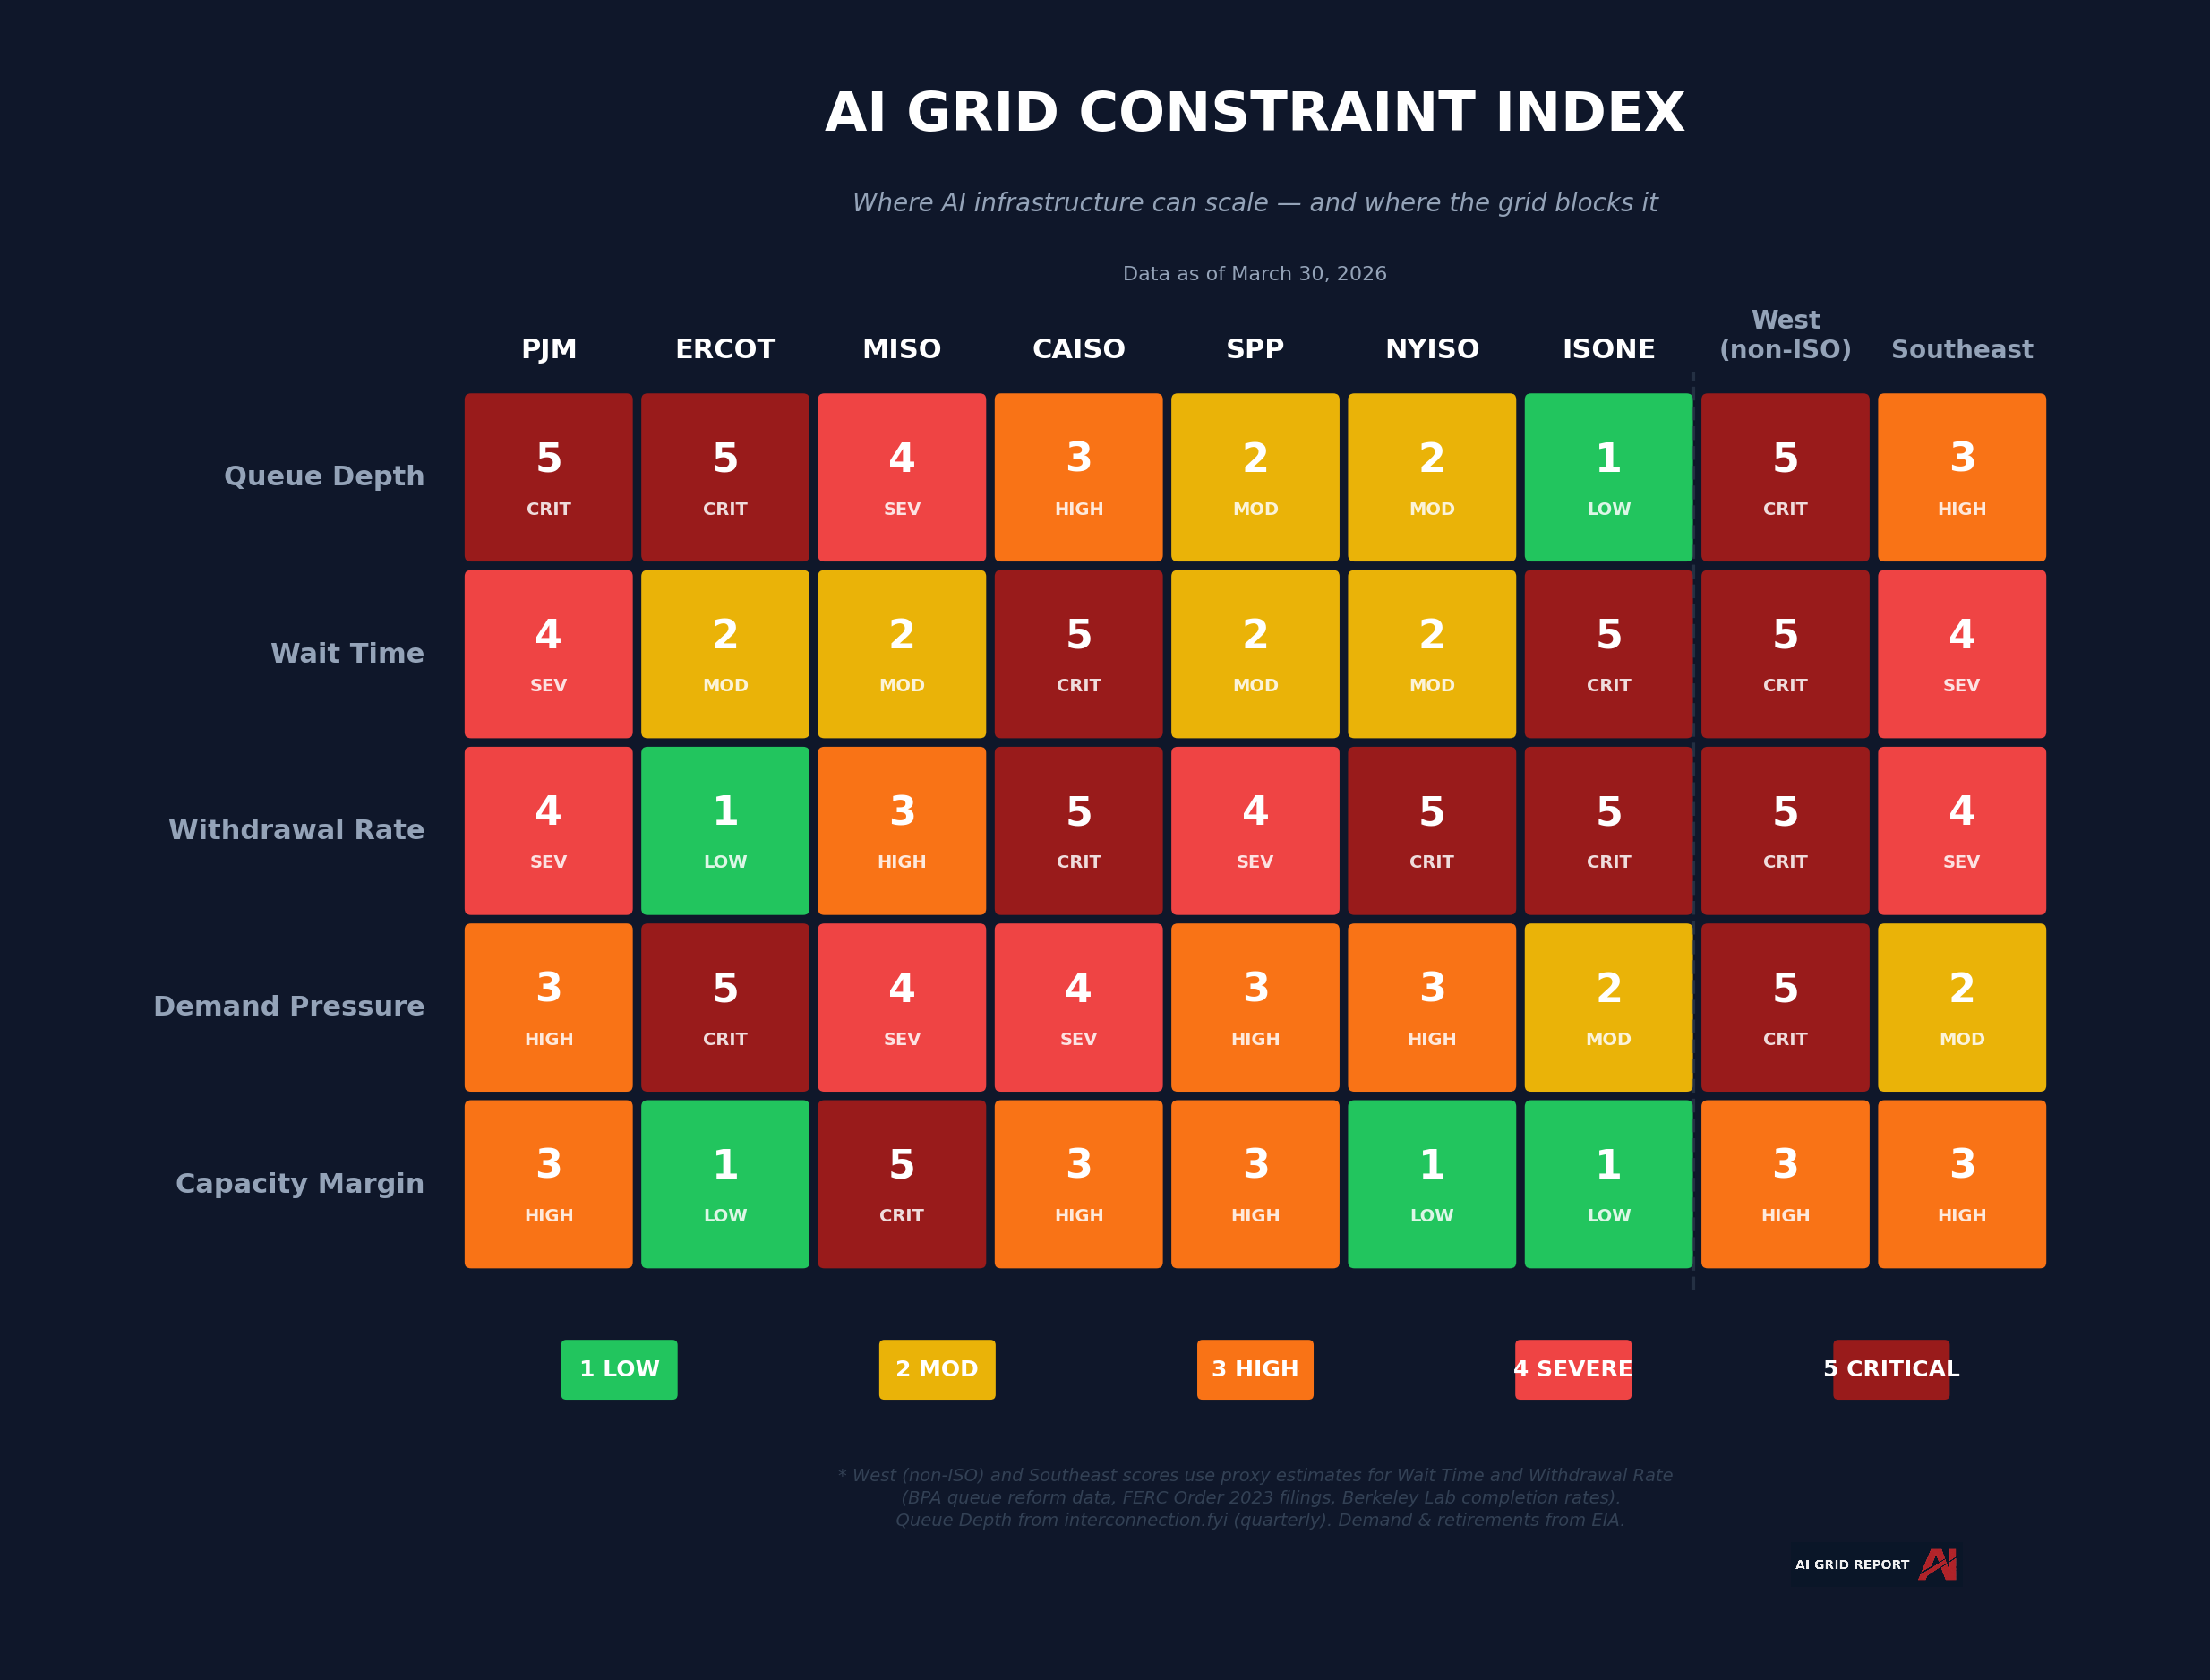
The AI Grid Constraint Index
A system to track:
– where capacity is actually available
– where projects are getting through
– where the grid is becoming a bottleneck
Below is a simplified view.
Preliminary View — Full Index Available to Subscribers
Full Index + Regional Breakdown → Subscribers
The constraint is visible.
But it isn’t evenly distributed.
And that’s where the real signal is.
AIGR is normally a paid report.
But for our launch, we’ve unlocked this issue.
Subscribe for free to access full future article.
Referral Incentives
If you’re finding this useful, you can unlock premium access by referring others.
1 referral → 1 month free
3 referrals → 3 months free
5 referrals → 6 months free
If you’re reading this as a subscriber, your personal referral link is always included in the email version of this report.
If you’re not yet subscribed, we highly encourage you to join below to get access to your subscriber perks.
Inside the Constraint
Subscribers get access to the full AI Grid Constraint Index:
– where projects are actually clearing
– where delays are compounding
– where capacity is still available
The AI Grid Constraint Index
Each month, this newsletter publishes a heatmap scoring nine US grid regions across five constraint dimensions: queue depth, wait time, withdrawal rate, demand pressure, and capacity margin. Scores run from 1 to 5.
Think of it as a traffic report for the power grid. Green means capacity is available. Red means projects stall. Dark red means the system is structurally failing.
The full methodology — exact thresholds, data sources, and scoring assumptions — publishes in Issue 02. If you are making infrastructure decisions against these scores, you should know exactly how they are calculated.
The constraint we just discussed isn’t evenly distributed.
It concentrates.
Some regions process capacity. Others absorb demand they cannot convert into power. The difference determines where infrastructure actually gets built.
This Week’s Reads
PJM scores the highest overall constraint. A 254 GW queue, 9,251 total projects, and a 67.4% withdrawal rate combine to produce the worst interconnection environment in the country. If your AI power strategy depends on the mid-Atlantic grid, the process itself is your primary risk.
ERCOT tells a different story — or appears to. Its queue holds 283 gigawatts of active projects across 1,832 applications, with a withdrawal rate near zero.
Projects in Texas enter the queue, move through it, and connect. But connection is not delivery. The substations, transformers, and transmission lines that serve current demand are being asked to absorb 5.6 times their capacity in new generation.
When the transmission path to load centers is saturated, connected projects hit curtailment, congestion, and negative nodal prices. Your wind farm clears the queue, hooks up to the grid, and discovers its power has nowhere to go.
Speed of process does not eliminate the constraint. It relocates it — from the queue to the operating grid, where it shows up not as withdrawal but as electrons that can’t reach the customer willing to pay for them.
CAISO presents a policy paradox. California mandates the most aggressive clean energy buildout in the nation. Its interconnection queue has a 75.6% withdrawal rate. Three-quarters of projects enter, study, wait, and leave. The policy ambition and the process reality are moving in opposite directions.
The Western non-ISO region — anchored by the Bonneville Power Administration across the Pacific Northwest and Mountain West — carries the single largest queue by volume at 369 GW. Much of this is wind and solar seeking access to transmission corridors that were built decades ago for hydroelectric power. The resource is there. The wires are not.
MISO faces a unique compounding risk. A 230 GW queue, significant withdrawal rates, and the highest retirement exposure in the country at 32% of demand equivalent. The Midwest is simultaneously losing old generation and failing to connect new generation.
ISO New England is the calmest region on the board. Just 15 GW in its active queue, a 1.0x demand pressure ratio, and modest retirement exposure. But New England’s constraint is different: it has limited capacity to absorb large-scale AI load in the first place. A calm queue on a small grid is not necessarily an opportunity.
The Mismatch
AI scales in: → quarters.
Power scales in: → decades.
Training clusters are deployed in months. Inference capacity is added in weeks. A hyperscale data center can be designed, permitted, and constructed in two to three years. A transmission line takes seven to twelve years from proposal to energization. A large natural gas plant takes four to six. Even solar and battery projects face three to five years in the interconnection queue before construction can begin.
The gap between those two curves is not a temporary mismatch. It is a structural feature of how these two systems operate. By the time the wire is approved, the data center could have been operating for a decade.
And the gap is widening. AI capital expenditure is accelerating. Grid reform is, at best, incremental.
The Compounding Pressure
The queue is only half the problem. While the new generation waits to get in, the old generation is walking out the door.
Across the United States, aging coal and natural gas plants are retiring on fixed schedules. These retirements are driven by economics, regulation, and in many cases, the physical age of the equipment. They are not discretionary. They are not contingent on what replaces them. They are happening regardless.
In MISO, 32% of average demand equivalent is scheduled for retirement — the highest of any region we track. Coal plants are closing on known dates. The solar and storage projects meant to replace them are stuck in a process that takes years to complete.
This creates compounding pressure. The queue delays new generation. Retirements remove existing generation. And demand — driven by data centers, electrification, and industrial reshoring — continues to grow. The three forces are moving in the same direction, and none of them is slowing down.
The Question
You have been modeling power as a solvable input. Model the demand, finance the plant, build the data center, connect to the grid.
The 2,300 gigawatt backlog disagrees.
The reality:
→25,000 projects. A 2.3 terrawatt backlog. A process that destroys two-thirds of the projects that enter it.
You can’t bid your way to the front of a physics-limited queue. You can’t buy transmission capacity that does not exist. You can’t accelerate an engineering study by offering to pay more for it.
Capital is already migrating. Developers are not asking where AI wants to build. They are asking where the grid will let it. The regions that answer that question correctly will attract the next decade of infrastructure capital. The regions that don’t will watch it leave.
The constraint is not priced. The reallocation has already begun.
This publication exists to answer that question before the market does.
Where AI wants to build is easy to find. Everyone knows. The data feeds tell you.
Where it can—that’s the only question that matters.
Next Week: Behind the Scores
Next week we’ll break down the full methodology behind the AI Grid Constraint Index — the thresholds, data sources, and assumptions that drive each score.
Because if these numbers are going to influence capital allocation, you need to understand exactly how they’re built — and where they break.
It’s a political hot potato for state and federal bureaucrats. Invest taxpayer dollars to cut the red tape, replace aging grid infrastructure, and speed up the Ai revolution that will replace millions of jobs with Ai.
This is such an eye opening article. The part that feels underappreciated:
Demand is moving on a 2–3 year timeline.
Infrastructure is moving on a 7–10 year timeline.
That gap doesn’t resolve smoothly.
It forces prioritization.
And that’s where pricing, location, and access start to diverge.
It will be interesting to see how this gap progresses in the next 12-24 months as demand for AI explodes.