
Everything Connects in Texas. That’s the Problem.
ERCOT has the fastest interconnection in the U.S.—and the highest system stress. The constraint didn’t disappear. It moved.


The Paradox
Texas has a 0% withdrawal rate.
Every project in the interconnection queue gets through.
→ No mass cancellations.
→ No multi-year attrition.
→ No system breakdown at the application stage.
On paper, it’s the most efficient grid in the United States.
But the queue is only one part of the system.
The grid behind it is a different question.
From Hardware Constraints to System Constraints
Last week, we outlined the emerging hardware constraint — transformers, substations, and long-lead equipment.
This week, the focus shifts.
Texas doesn’t fail at the hardware layer. It doesn’t fail at the queue.
It fails somewhere else.
Two Systems, Two Outcomes
The contrast with PJM is stark.
PJM:
9,251 active projects
67.4% withdrawal rate
~3.5-year average wait time
ERCOT:
1,832 active projects
0% withdrawal rate
~710-day average timeline
Two systems. Two completely different outcomes.
At first glance, the conclusion seems obvious:
PJM is constrained. ERCOT works.
But the data doesn’t fully support that.
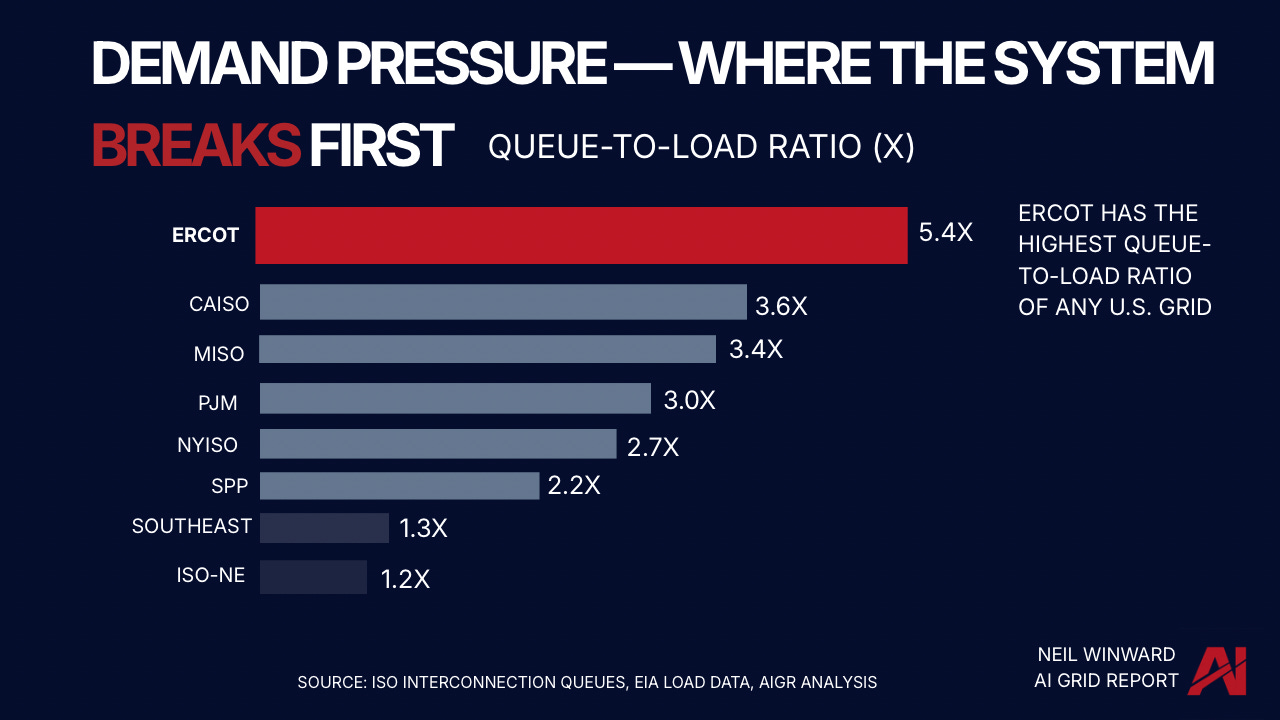
The Signal Beneath the Surface
Demand pressure tells a different story. Demand pressure is measured as the ratio of generation ready to deliver power to peak load (which is a close proxy for the grid’s capacity to satisfy that load).
PJM demand pressure:
~3.0x
ERCOT demand pressure:
5.4x — the highest in the country
Nearly six times more capacity is attempting to connect than the system currently supports.
Where the Model Starts to Break
So:
every project gets through
timelines are shorter
the queue appears functional
And yet:
the system is under the highest pressure in the country
Those two things should not coexist.
The Open Question:
If the queue isn’t the bottleneck, where does the constraint actually show up?
In This Week’s Edition
Most analysis stops at the queue.
That’s not where the problem is.
This week’s edition breaks down:
why 0% withdrawal does not mean low risk
where ERCOT is already showing signs of saturation
how the constraint moves from the queue to the operating grid
what the reliability tradeoff actually means for AI infrastructure in Texas
The full Constraint Index shows exactly where this pressure is building—and where it’s about to break.

Continue reading →
