
The Grid Can’t Keep Up With Oil’s Shock
Why electrification demand is accelerating into a system that decides what gets built—and what doesn’t


Oil prices can move overnight.
Electrification demand can follow quickly.
But the infrastructure required to support that demand—generation, transmission, interconnection—does not.
That mismatch is no longer abstract.
It is already determining where projects clear, where they stall, and where capital flows.
The assumption that demand drives outcomes is breaking.
The grid decides what scales.
Early Scale
Data center campuses now require 500 MW–1 GW of continuous load
U.S. interconnection queues exceed 2,000 GW
Transmission build timelines stretch 7–12 years
Big Tech is deploying ~$600B+ into data center infrastructure against a system that cannot absorb it on the same timeline.
Demand is accelerating into a system structurally incapable of responding at the same speed.
Why This Matters
For nearly two decades, U.S. electricity demand was flat. That era is over.
Demand is no longer the constraint.
Absorption is.
Multiple forces are now pushing demand higher simultaneously:
AI data center load
Electrification of transport and heating
Industrial reshoring
The disruption in the Strait of Hormuz has added a new forcing function.
Brent crude has moved above $100.
A chokepoint responsible for ~20% of global oil flows has been partially shut.
OIL SHOCK CHART - BRENT VS. HORMUZ
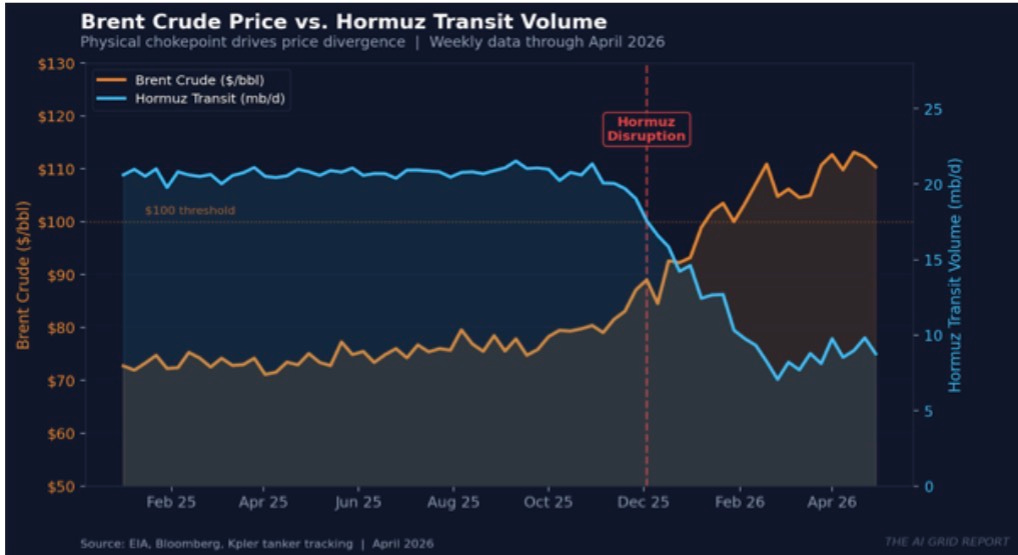
The Shock
The Strait of Hormuz—conduit for roughly 20% of global oil flows—is now open only to vessels with Iranian escort with transit tolls paid in RMB or stablecoin…or a backstage pass from the IRGC.
This is not a supply problem. It is a logistics constraint.
Producers can still produce, but they can’t move the product. Logistics constraints don’t resolve quickly. A short disruption drives temporary substitution; a prolonged disruption drives structural change. The market is attempting to price both at once.
Market Signal
WTI vs Brent Broke a Pattern.
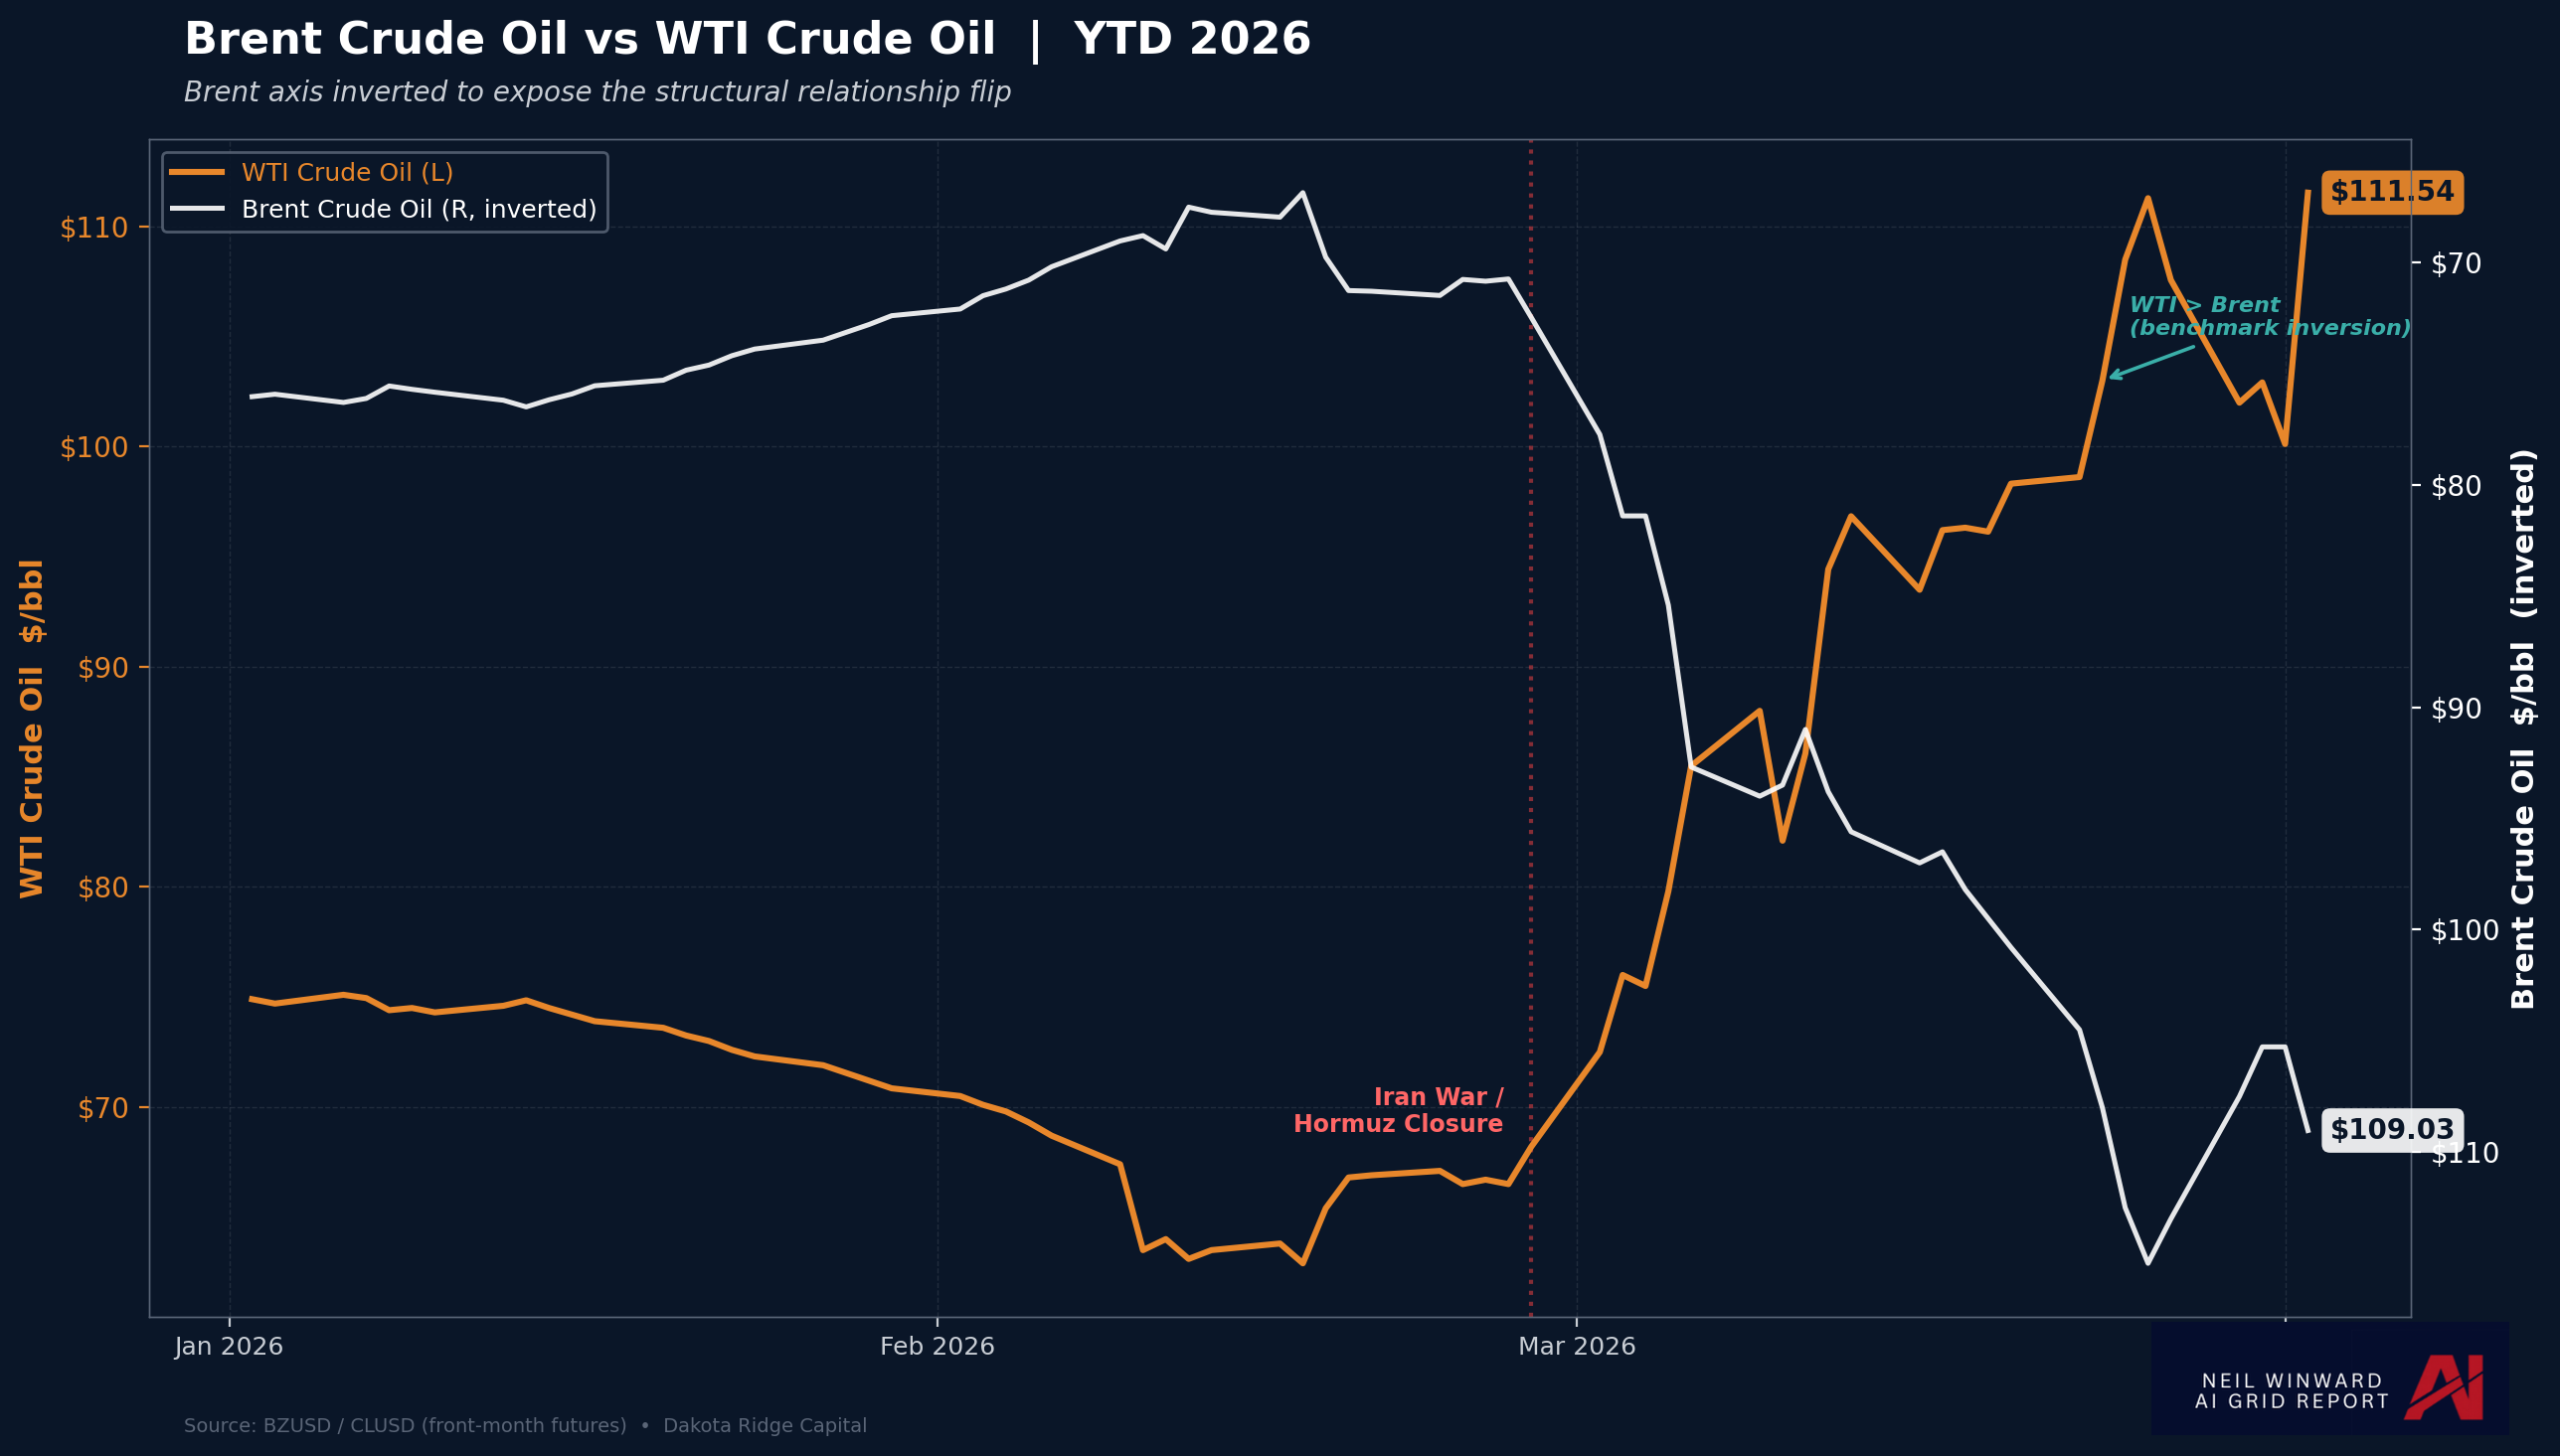
What began as a dislocation in geography sent Brent Crude up, Asian crude higher, and West Texas Intermediate (WTI) lower.
Then Brent and WTI flipped. The replacement for lost Middle East supply wasn’t prompt North Sea production. It was US exportable crude.
WTI became the marginal scalable barrel.
But the US itself imports ~750k bpd from the Middle East and Atlantic Basin. With those imports stalled, domestic refiners went short — bidding up the same barrels the export market wanted.
WTI is now being pulled from both ends: Export substitution demand and tighter domestic balances.
The Shift
When fuel prices spike, electrification accelerates. That part is predictable.
The economics reprice quickly. Electric alternatives become more competitive as fuel prices rise. EV cost-of-ownership improves. Heat pumps and induction systems gain share. Import-dependent regions accelerate substitution faster.
Electrification is a demand response to volatility.
Demand is not the constraint; infrastructure is. And that’s where the market starts to break, because what’s happening now is not just a demand increase.
It’s a pricing problem.
The market is attempting to price two incompatible timelines at once:
short-term disruption
long-term structural shift
That tension is already visible in how crude is trading. Not because production has changed, but because logistics has.
Geography—not just supply—is beginning to determine price, and once geography drives pricing, infrastructure becomes the constraint layer capital has to navigate.
Most capital isn’t positioned for that.
It is still flowing toward demand density—not infrastructure readiness.
That mismatch is where the system fractures.
Electrification doesn’t remove constraints.
It relocates them.
From oil…to electricity.
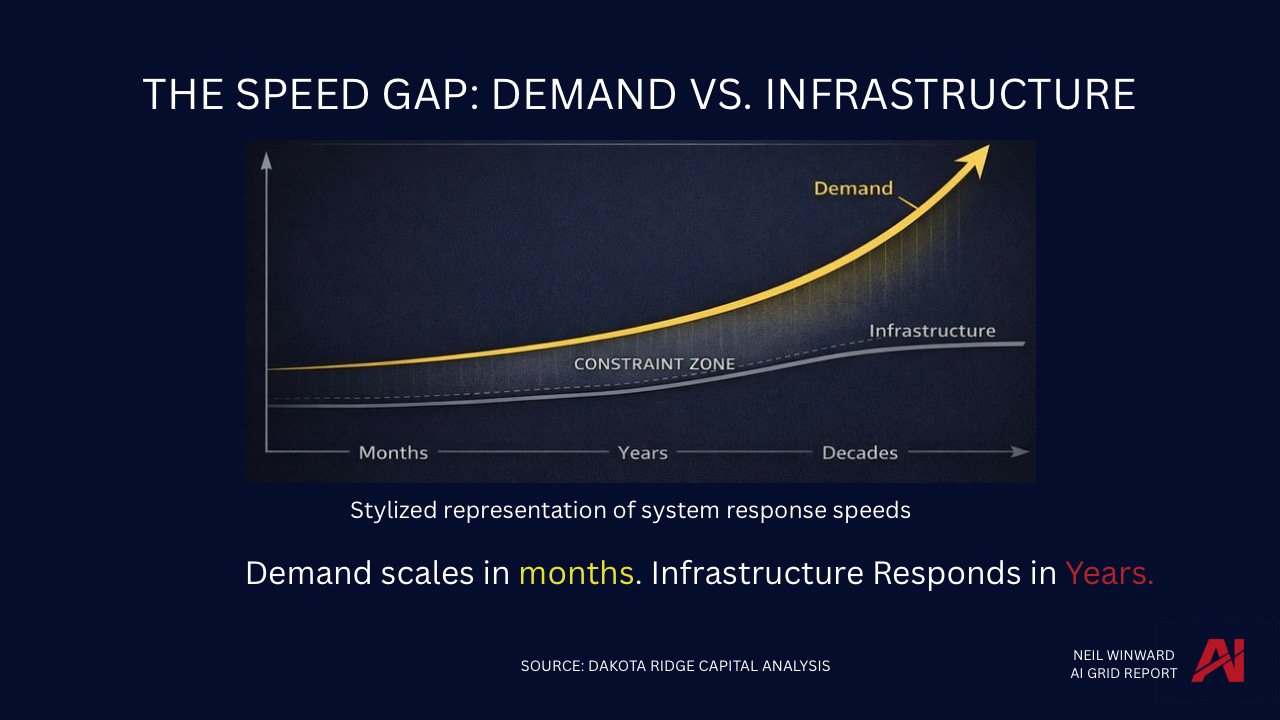
THE SPEED GAP — DEMAND VS INFRASTRUCTURE
Capital Signal
Capital is concentrating in the most constrained parts of the grid.
PJM alone accounts for over $100B in data center investment, despite operating within one of the most congested interconnection regimes in the U.S.
Queue timelines extend multiple years, transmission limits are binding, and projects increasingly require significant network upgrades before power can be delivered.
This is not an edge case. It is becoming the baseline.
Projects modeled on ideal timelines are slipping years. A solar-plus-storage project expected online in 2027 can realistically energize closer to 2030.
Data center campuses are facing hundreds of millions in grid upgrade costs before a single megawatt is delivered.
This is not a demand problem. It is a system constraint.
Capital is underwriting growth as if infrastructure is neutral. It isn’t. It is the gating function—and that creates a structural mispricing be
The Transition
The gap is already visible. Demand compounds in months. Infrastructure responds in years. That gap doesn’t stabilize — it widens.
The grid is not failing. It is filtering, delaying, prioritizing, rejecting.
What matters now is not how fast demand grows. It’s where that demand can land — and where it can’t.
This Week’s Constraint Index:

The distribution is uneven. Buildable regions are limited, constrained regions dominate, and saturated regions are already rejecting new demand. This is not a scaling environment — it is a filtering system.
The constraint is no longer theoretical. It is already determining where projects get built, where capital flows, and which regions can actually absorb demand. Most analysis stops at “demand is growing.” That’s not the edge. The edge is knowing where the grid can support it — and where it can’t.
In this week’s issue, we break down:
• the regions where the constraint is already binding
• which markets can still absorb load—and why
• where capital is mispriced relative to infrastructure reality
This Thursday, we’ll break down the full methodology behind how the Constraint Index is constructed and what each component is actually measuring.
➡️ Full analysis available to subscribers
